May 2023 Newsletter
Hello TuringTrader Member,
“Sell in May and Go Away” is an often-cited investment idea, aiming to benefit from seasonal differences in stock market returns. And, given that the past few days have been a bumpy ride, one might ask if there is some truth to that. Let’s find out.

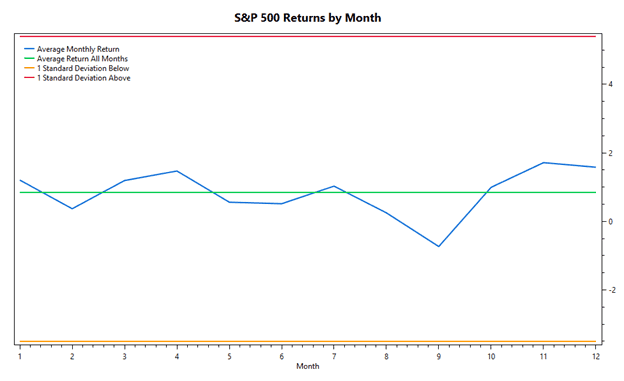
When charting average monthly returns from 1970 to today (53 years), it seems that this simple saying has some merit: we can see that the five months from May to September indeed underperform. To create some more context, we calculated the range one standard deviation above and below the average monthly returns. The monthly averages are well within these boundaries, telling us that the statistical significance of this deviation is rather low and likely not suitable for trading.

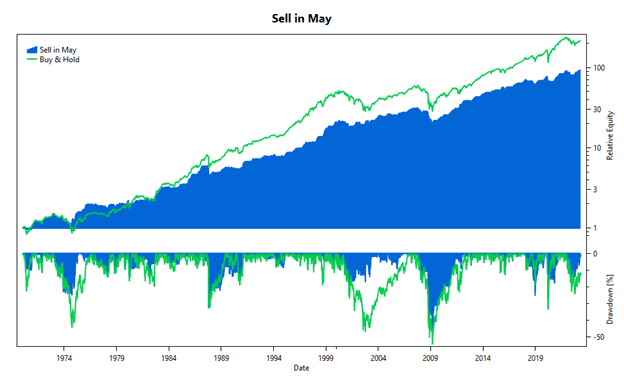
Nonetheless, we ran a backtest of this trading idea. We can see that, on absolute metrics, the strategy certainly underperforms. However, we can see that in 1974, 2002, 2009, 2011, and 2022, the drawdowns were lower. Maybe there is some value there?

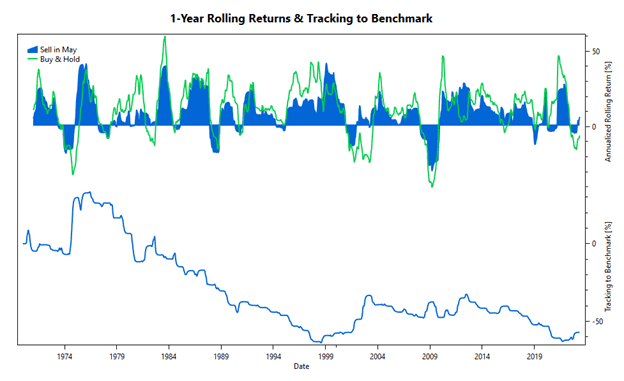
The tracking chart shows how between 1976 and 1999, the strategy was continually underperforming its benchmark, while in more recent history its performance was about on par with buy and hold. However, these results must be taken with a grain of salt: Because the strategy makes only two trades a year, there is only very little data to lean upon, and we might just have gotten lucky.

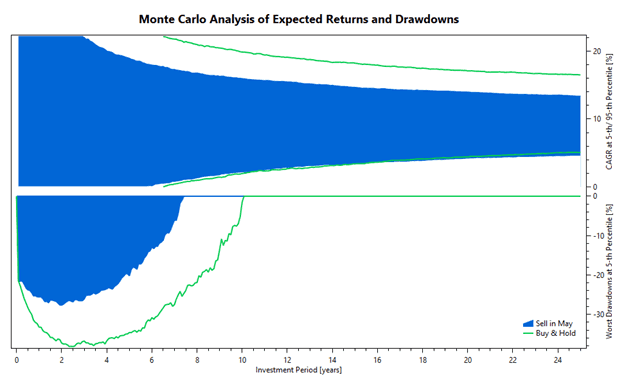
Monte Carlo simulations can expand these horizons by exploring what might happen moving forward. This simulation shows a sobering result: At the 5th percentile, we notice almost no change. However, at the 95th percentile, we miss out on potential upside. I hope you don't mind that we won't be tracking this strategy on the site.
This simple example shows how the analysis of an investment strategy is a multi-dimensional problem. We should always ask ourselves if the underlying idea makes sense, pay close attention to the various charts, and be aware that metrics, especially CAGR and maximum drawdown can be deceiving. Therefore, we encourage all TuringTrader members to learn about our charts & metrics, our backtesting assumptions, and the mechanics of our portfolio wizard.
As always, I want to thank everybody who reached out over the past month with questions, comments, and suggestions. It’s an honor to have you on our site. If you like what we do, support our growth by sharing how TuringTrader adds value for you with your friends.
Stay tuned for further updates,
All the best
Felix
--
Felix Bertram
Founder of TuringTrader.com

