Livingston's Papa Bear
Similar Portfolios
- Objective: balanced growth
- Type: momentum strategy
- Invests in: ETFs tracking equities, fixed-income, and hard assets
- Rebalancing schedule: monthly
- Taxation: 90% short-term capital gains
- Minimum account size: $3,000
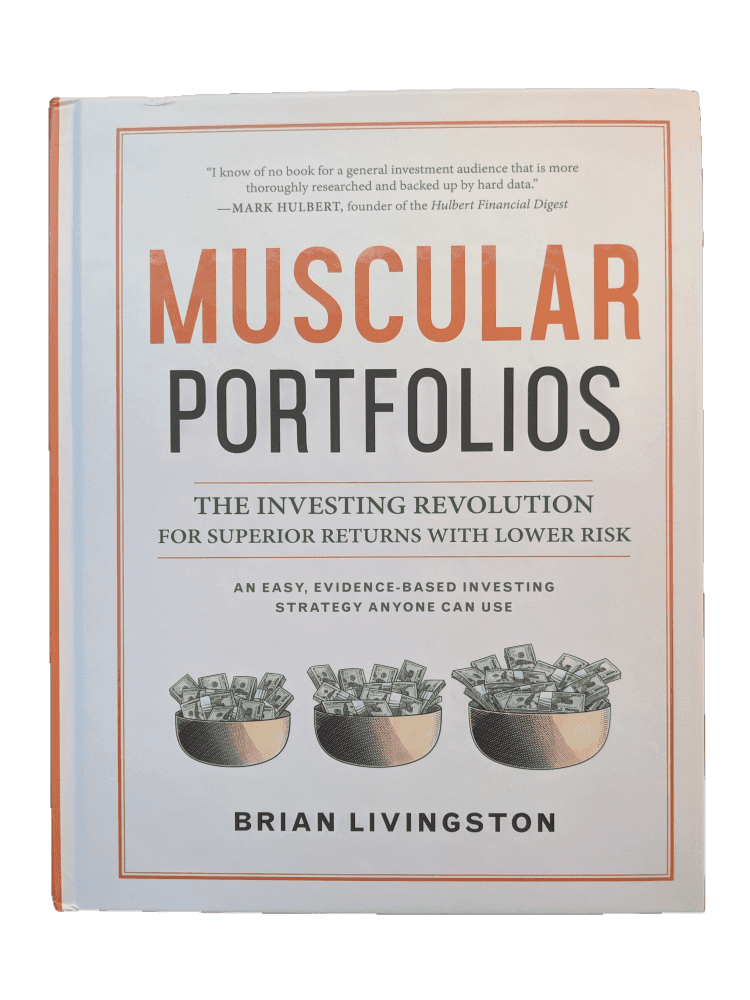
Brian Livingston is a successful dot-com entrepreneur and an investigative journalist. Livingston published the Papa Bear strategy in the book Muscular Portfolios, which he released in 2018.
Livingston's Papa Bear aims to achieve stock-like returns, while requiring only little maintenance and avoiding deep drawdowns. Papa Bear achieves its objective through a momentum-based selection of three ETFs from a menu of thirteen, covering all major asset classes.
The portfolio requires only little maintenance: rebalancing is scheduled once per month.
Strategy Rules
The operation of Papa Bear can be summarized as follows:
- trade a universe of thirteen ETFs covering U.S. and international equities, U.S. fixed-income, and hard assets
- rebalance monthly
- rank all assets by the average momentum over 3, 6, and 12-months periods
- allocate equal capital to the top-3 assets
Like most momentum strategies, an essential part of Papa Bears outperformance stems from losing less than passive portfolios during recession periods. Therefore, investors should always contemplate performance over the full economic cycle and not expect the portfolio to outperform in bull markets.
The book recommends skipping the monthly rebalancing unless an ETF is more than 20% off target. We feel that this exception makes it harder to communicate the target allocation to our readers. Consequently, we decided to rebalance our version of the portfolio every month. In our testing, this change made only very little difference to the overall results.
Diversification
While Livingston’s Papa Bear portfolio menu is diversified over three major asset classes, actual holdings might not be: the simple method of picking the three top-ranking ETFs can lead to being fully invested in just a single asset class. This shortcoming materializes in Papa Bear taking large hits when markets suddenly shift.
While more diversification is generally a good thing, it seems that Papa Bear did not benefit from enlarging the universe to thirteen assets. The universe includes several highly correlated assets, and a simple momentum-based selection does not seem sufficient to select between these. Condquently, Papa Bear's added complexity over Mama Bear has not led to superior returns.
Returns & Volatility
With about 25% drawdown, the portfolio managed the 2008 recession well, and did not miss out on 2009’s rebound. However, the strategy started struggling in 2015 and had a hard time recovering since.
Our Monte-Carlo simulation paints a slightly different picture though: Even though the simulated absolute drawdown is low, Papa Bear is overall riskier than a passive 60/40. Further, the simulated outperformance over a 60/40 only exists at lower confidence intervals and cannot be taken for granted.
Account & Tax Considerations
When the strategy changes its selection of top-ranking ETFs, it triggers taxable events. The chart shows that Livingston’s strategy rarely holds any assets long enough to qualify for long-term treatment of capital gains. Instead, the strategy most often closes its positions after 6 months or less. Consequently, Papa Bear works best in tax-deferred accounts.
With the strategy holding no more than three ETFs at a time, it should work well in accounts with $3,000 or more.
Summary
Performance
This table shows the portfolio's key performance metrics over the course of the simulation:
The following chart shows the portfolio's historical performance and drawdowns, compared to their benchmark, throughout the simulation:
Download as CSV
This chart shows the portfolio's annual returns:
The following charts show the Monte-Carlo simulation of returns and drawdowns, the portfolios 12-months rolling returns, and how the portfolio is tracking to its benchmark:
Asset Allocation
The portfolio last required rebalancing after the exchanges closed on . Due to fluctuations in asset prices, the exact allocations vary daily, even when no rebalancing occurred. The current asset allocation is as follows:
| Symbol | Name | Allocation |
|---|---|---|
| … | … | |
| … | … | |
| … | … |


