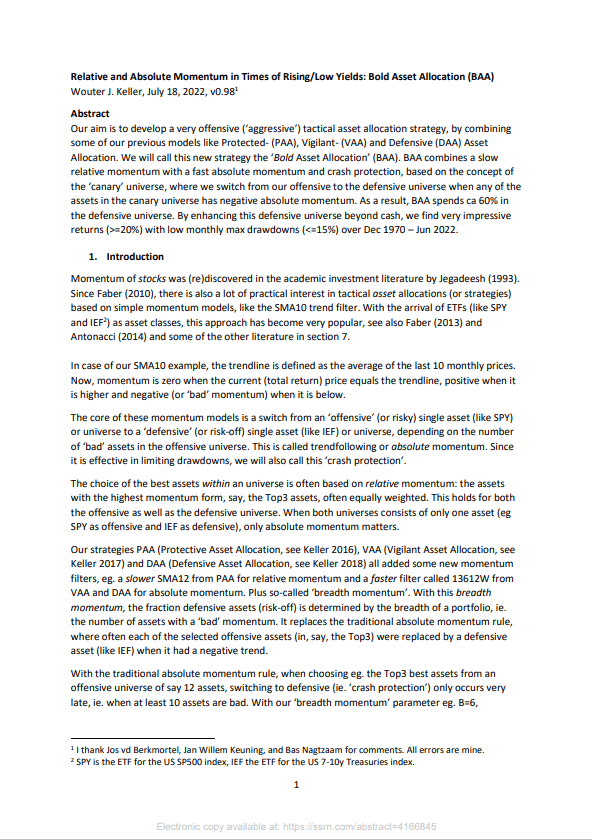
Keller's Bold Asset Allocation
Similar Portfolios
- Objective: balanced growth
- Type: momentum strategy
- Invests in: ETFs tracking equities, fixed income, and hard assets
- Rebalancing schedule: monthly
- Taxation: 90% short-term capital gains
- Minimum account size: $10,000
Keller’s Bold Asset Allocation aims to provide a healthy, diversified asset allocation with superior protection against sudden market downturns. The strategy uses a unique canary universe to detect market turbulence and rotate from offensive assets into more defensive holdings to achieve this goal. With its monthly rebalancing schedule and docile behavior, the strategy appeals to a wide range of risk-aware investors.
The strategy was developed by Wouter J. Keller, a researcher at the VU University Amsterdam and the CEO of Flex Capital, an asset management firm based in the Netherlands. He published his Bold Asset Allocation in a paper released in mid-2022.
Strategy Rules
Source
Learn More
Keller’s Bold Asset Allocation exists in multiple flavors that differ in their universe’s composition. Our implementation of Keller’s strategy is true to the publication’s BAA-G12 variant. The strategy’s operation can be summarized as follows:
- trade an offensive universe of twelve assets covering U.S. and international equities, hard assets, long-term treasuries, corporate bonds, and high-yield bonds
- trade a defensive universe of high-quality bonds and commodities
- use a canary universe to detect market turbulence and switch between the universes
- rank the assets in each universe by momentum, and allocate capital to the top-ranking assets
For full detail and the rationale behind Bold Asset Allocation, refer to Keller’s detailed paper. Further, the C# source code for the strategy is included in the TuringTrader.org open-source project repository.
Keller’s strategy successfully solves a typical problem of tactical investment strategies: Reducing noise from momentum indicators while at the same time allowing the system to react to changes in market regime swiftly. Keller’s refined approach of using a canary universe to detect market regimes is highly functional yet charmingly simple. This simplicity is essential in confidently following the strategy’s asset selections without second-guessing.
Diversification
Keller’s strategy spends about half of the time in the defensive universe, which contains high-quality debt and commodities. As a result, the Bold Asset Allocation has a very low beta and, thanks to including absolute momentum in the defensive universe, low interest-rate risk.
Keller’s strategy only enters its offensive regime briefly when circumstances appear favorable. When it does, the strategy may invest all of its capital in the stock market, albeit in indices tracking various markets. This exposure leads to significant tail risk should markets outpace the strategy’s ability to switch to its defensive regime.
Returns & Volatility
Overall, the Bold Asset Allocation shows very docile behavior with steady returns over the last economic cycle: BAA gracefully handled the 2008 recession and excelled during the 2009 rebound, the challenging markets of 2015, and the short-lived downturn of 2020.
The Monte Carlo simulation shows that Keller’s strategy offers significant value to investors: Bold Asset Allocation achieves higher returns than the 60/40 benchmark while at the same time significantly reducing drawdowns and speeding up recovery.
However, these advantages come at a psychological cost. Over the backtested period, Bold Asset Allocation was trailing its benchmark in most years. The strategy follows a ‘win more by losing less’ approach, with its upside generated mainly during the recessions of 2008 and 2022.
Account & Tax Considerations
Just like other strategies rotating assets, this strategy frequently causes taxable events. The chart above shows that investors cannot expect Bold Asset Allocation to hold any asset long enough to qualify for long-term treatment of capital gains. Consequently, BAA works best in tax-deferred accounts.
Keller’s strategy invests in up to 9 ETFs simultaneously. Therefore, it requires an account size of no less than $10,000 to function correctly.
Portfolio Revisions
- v1, November 2022: Initial release.
Summary
Performance
This table shows the portfolio's key performance metrics over the course of the simulation:
The following chart shows the portfolio's historical performance and drawdowns, compared to their benchmark, throughout the simulation:
Download as CSV
This chart shows the portfolio's annual returns:
The following charts show the Monte-Carlo simulation of returns and drawdowns, the portfolios 12-months rolling returns, and how the portfolio is tracking to its benchmark:
Asset Allocation
The portfolio last required rebalancing after the exchanges closed on . Due to fluctuations in asset prices, the exact allocations vary daily, even when no rebalancing occurred. The current asset allocation is as follows:
| Symbol | Name | Allocation |
|---|---|---|
| … | … | |
| … | … | |
| … | … |


