Heine's Bond Trading Model
Similar Strategies
- Objective: income
- Type: trend-following strategy w/ macro-economic indicators
- Invests in: ETFs tracking corporate bonds and T-bills
- Rebalancing schedule: weekly
- Taxation: 80% short-term capital gains
- Minimum account size: $1,000
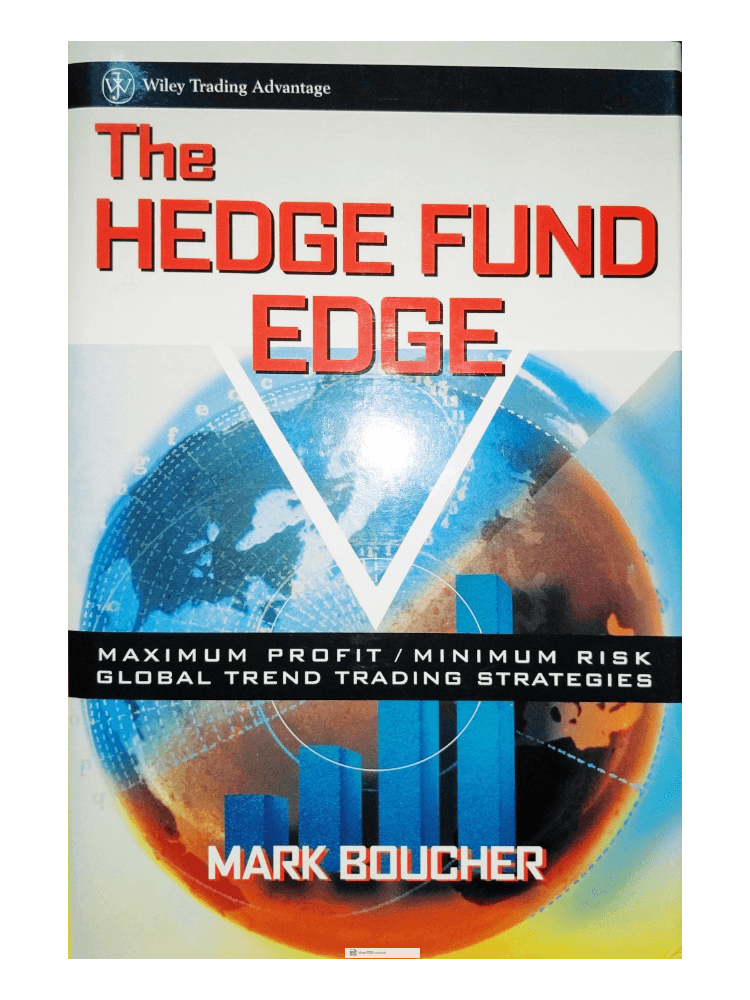
Richard Heine was the founder and president of Income and Asset Advisory Inc, a capital management firm based in New York. Heine's Bond Trading Model was first published in 1995 through Nelson Freeburg's Formula Research newsletter. In 1999, Mark Boucher described the same strategy in his book The Hedge Fund Edge.
Heine's Bond Trading Model aims to beat buy-and-hold of its traded asset and, more importantly, cut much of the risks associated with bonds. The Bond Trading Model achieves its objective by combining price indicators with macroeconomic signals. In a nutshell, the strategy combines two crucial mantras in investing: Don't fight the tape and Don't fight the Fed.
The portfolio has relatively low maintenance requirements. While it calls for weekly rebalancing, this process is rather simple because it only holds a single ETF.
Strategy Rules
Strategy Rules
The operation of Heine's Bond Trading Model can be summarized as follows:
- If bond prices are trending up, score +1 point; otherwise, give 0 points.
- If long-term treasury yields trend down, score +1 point; otherwise, give 0 points.
- If short-term treasury yields trend down, score +1 point; otherwise, give 0 points.
- If the Dow Jones Utility Average is trending up, score +1 point; otherwise, give 0 points.
- If the CRB Index is trending down, score +1 point; otherwise, give 0 points.
- Rebalance weekly. If the total score is three or more, hold bonds; otherwise, carry cash.
The book determines trends by comparing the time series to their moving averages. As time constants, the author recommends short smoothing periods of 6 weeks for the yields and longer periods of up to 24 weeks for the other indicators.
While the book trades the now discontinued Dow Jones 20 Bond Index, it encourages applying the same strategy to other markets. Accordingly, we have chosen to use the strategy to trade corporate bonds here.
Diversification
The strategy only invests in a single ETF market and T-Bills as a risk-off asset. Consequently, its diversification primarily depends on the breadth of the ETF traded.
Returns & Volatility
The strategy's rolling returns nicely show how the strategy is, for the most part, successfully avoiding periods of negative returns. This is particularly true for periods of rising interests rates. In addition, the Monte-Carlo simulation shows how Heine's Bond Model significantly reduces portfolio volatility and potential downside while at the same time only giving up minimal upside.
Account & Tax Considerations
When the strategy changes its holdings, it triggers taxable events. Investors should not assume that any assets are held long enough to qualify for long-term treatment of capital gains. However, because interest payments from bonds are taxed with the regular income tax rate, this has only a small effect on the strategy's overall tax burden. In general, bond strategies work best in tax-deferred accounts.
Because the strategy only holds a single ETF at a time, an account of $1,000 or more is sufficient to trade the model.
Summary
Performance
This table shows the portfolio's key performance metrics over the course of the simulation:
The following chart shows the portfolio's historical performance and drawdowns, compared to their benchmark, throughout the simulation:
Download as CSV
This chart shows the portfolio's annual returns:
The following charts show the Monte-Carlo simulation of returns and drawdowns, the portfolios 12-months rolling returns, and how the portfolio is tracking to its benchmark:
Asset Allocation
The portfolio last required rebalancing after the exchanges closed on . Due to fluctuations in asset prices, the exact allocations vary daily, even when no rebalancing occurred. The current asset allocation is as follows:
| Symbol | Name | Allocation |
|---|---|---|
| … | … | |
| … | … | |
| … | … |


