Bonds and Rising Yields
See Also
Related Portfolios
Bonds combine characteristics that uniquely qualify them as a portfolio component: Negative correlation to the stock market, relatively low volatility, and a positive carry. Consequently, it is no surprise that bonds are an essential part of virtually all balanced portfolios, including the ubiquitous 60/40 portfolio. But in the light of historically low yields and the outlook of the Federal Reserve raising yields as soon as March 2022, we have to wonder if bonds continue to play this role moving forward. Accordingly, this article takes a closer look at bonds in a rising yield environment and the implications on investment portfolios.
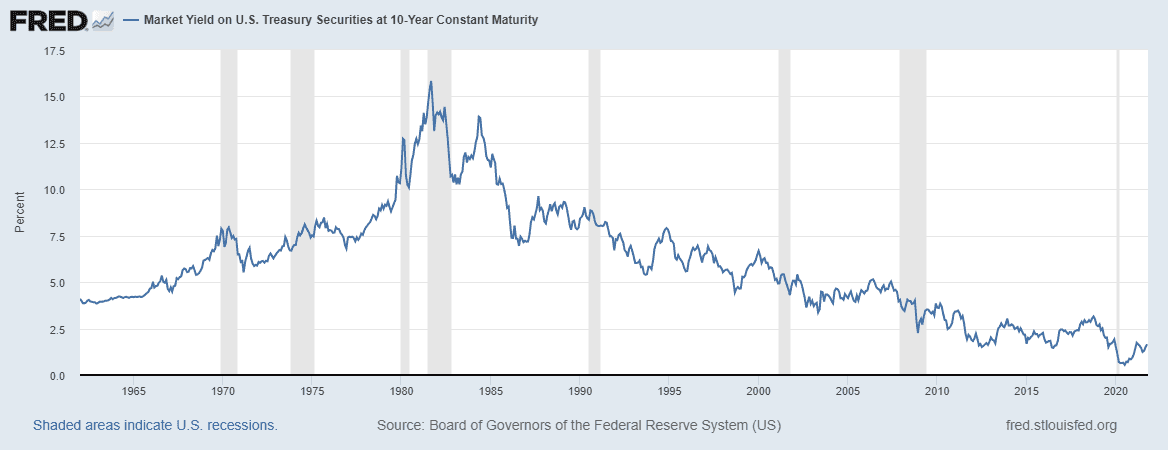
Bond Yields Declined Since 1984
Bond yields have been declining for decades. However, it might not be obvious why this was a good thing for investors. Bonds are typically considered fixed-income investments. This characterization implies that declining yields are bad because it reduces the interest paid by the bonds. However, this is only one side of the coin. Bond valuation formulas dictate that prices of existing bonds must go up when the yields of newly issued bonds decline. Therefore, investors reap capital gains on the bonds they already hold in return for lower interest payments on the bonds they buy moving forward.
To find a period of continually rising bonds yields, we must go far back. Bond yields peaked in September 1981 at about 15.8% and steadily declined since June 1984. Consequently, we need to go even further back if we want to learn something about environments of rising yields. For this article, we have chosen to go back to January 1968. That gives us 13 years of rising yields, plus another three years with a sharp decline followed by an almost equally swift recovery of bond yields.
Backfilling ETF Quotes
But going back that far is easier said than done. Back in 1968, those convenient ETFs tracking bond investments with various maturities did not exist. Moreover, even mutual funds with a similar purpose weren't available back then; Vanguard's VUSTX has an inception date of May 1986. Consequently, we need to do more than simply backfilling the missing ETF data with mutual funds. The solution is to create a mathematical model to synthesize the bond prices from historical yield data, as those are available back into the 1960s. Then, we splice our ETF quotes with the synthetical model's data to create a single time series representing our asset.
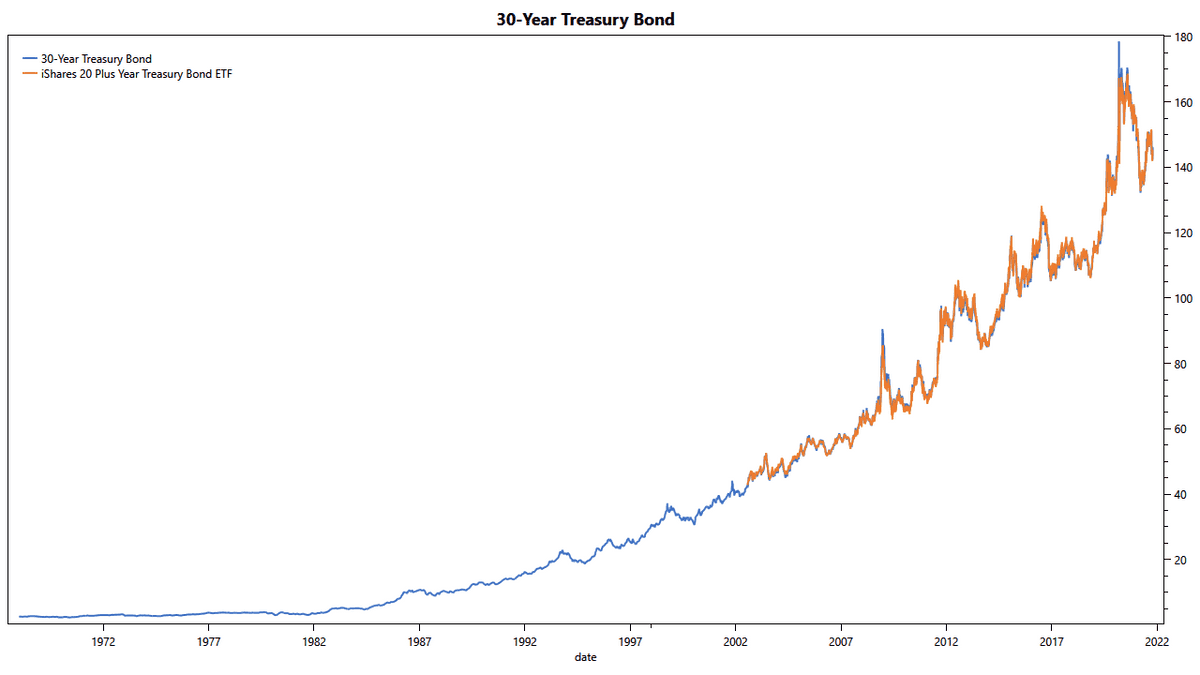
The chart above shows our model to backfill iShares' TLT. As you can see, the model quite accurately tracks the performance of the ETF. We are therefore confident that this method leads to valuable insights. We repeated the same process for TLH, IEF, and IEI, covering three to 20+ years of maturities.
Treasury Returns since 1968
We have seen above that declining yields lead to capital gains, especially with longer-term maturities. Unfortunately, the opposite is also true. For example, between 1968 and 1981, the 10-Year Treasury yield rose from 5.5% to 15.8%, and we would expect that Treasury bonds were an unfortunate investment choice in that period.
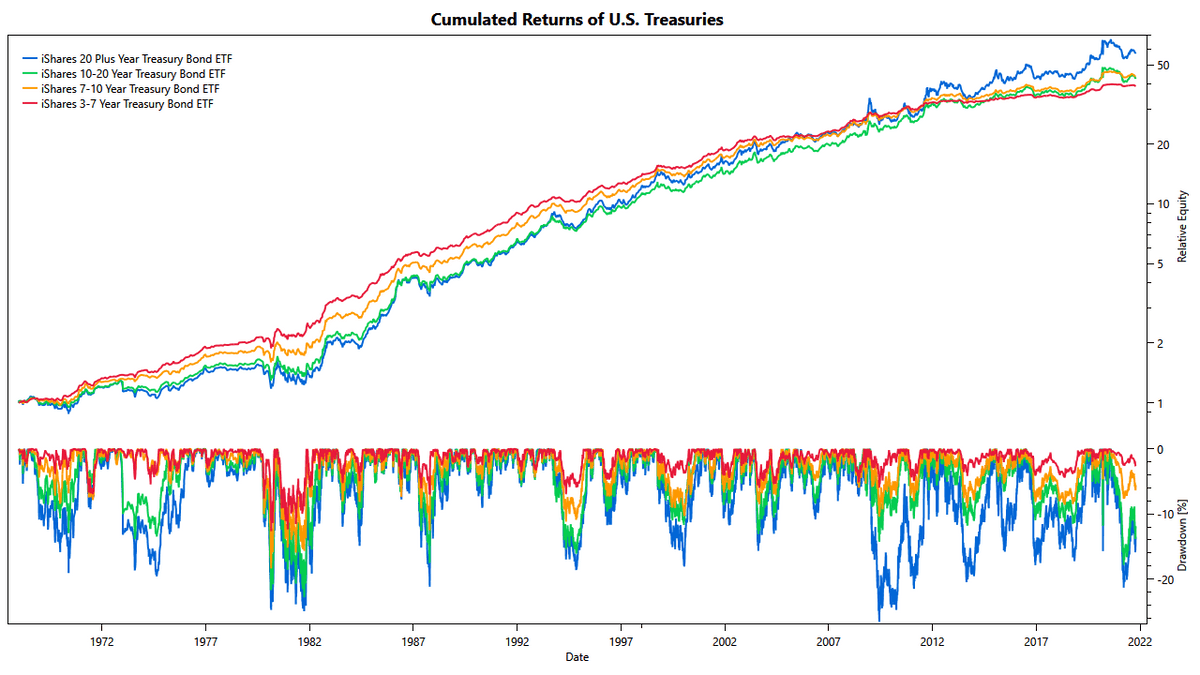
When comparing the cumulative returns of Treasuries of various maturities, we find that between 1968 and 1984, the 20+ Year bonds trail the returns of bonds with shorter maturities while outperforming them in later years. And over the past 54 years, all maturities ultimately led to quite similar results. However, their path has been different, and longer-term bonds showed deeper drawdowns and often slower recovery than their shorter-term cousins.
It is worth noting that the higher volatility of longer-term bonds may be desirable under certain circumstances. For example, if these bonds are used in a portfolio that also invests in stocks, the two partially counteract each other because of the negative correlation between stocks and Treasury bonds, overall dampening portfolio volatility.
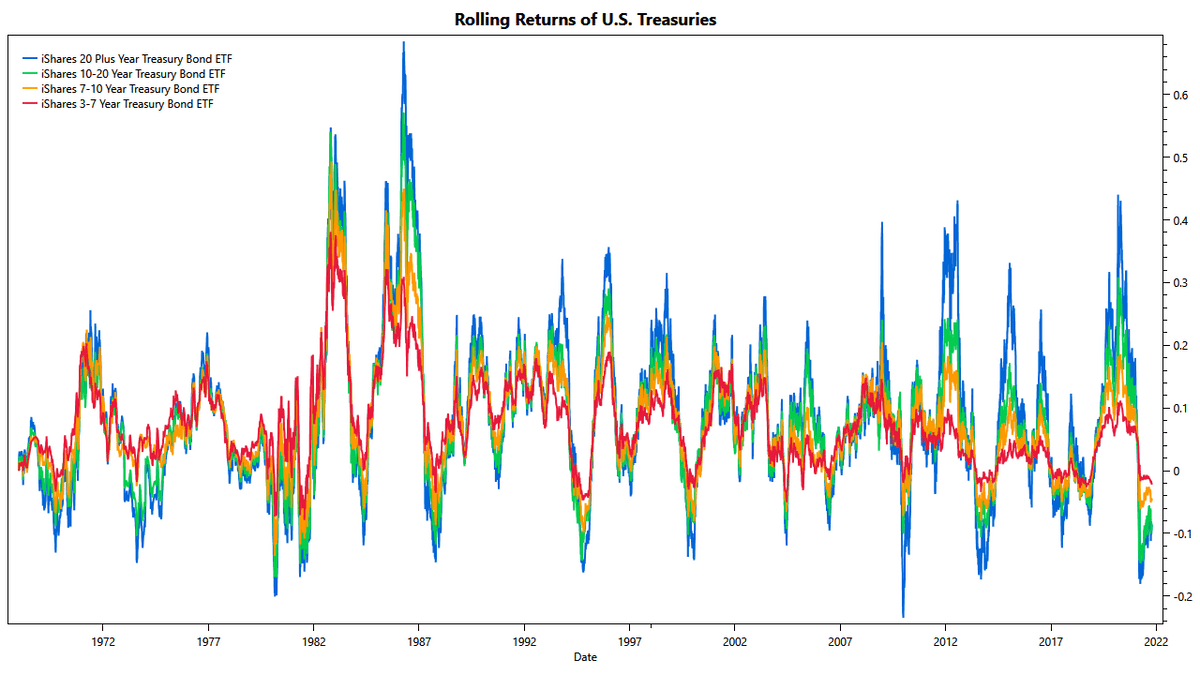
Graphing the 12-months rolling returns for the various bond maturities leads to a busy chart and further insights:
- 12-months rolling returns of short-term bonds rarely turn negative. This statement is true for all periods, including the environment of rising yields between 1968 and 1981.
- Rolling returns of long-term bonds move more violently but typically recover within a couple of years. Even in the decade leading up to the 1981 peak in interest rates, the periods of negative returns were relatively brief.
- All maturities show similar behavior. For the most part, longer-term bonds just amplify the behavior of their shorter-term cousins.
What stands out here is that rolling returns before 1981 don't appear fundamentally different from returns in later years. Instead, there is constant fluctuation with primary cycles of 6-months to 2-years length. We conclude that any trading strategy that maintains a continuous upside over its benchmark will likely do well in periods of rising rates.
Momentum-Based Trading
When thinking about trading strategies, momentum is usually the first approach that comes to mind. So why should bonds be any different? And here comes the spoiler: in our testing of dozens of configurations, momentum-based trading does not provide any measurable upside. But let's take a closer look.
Allocation by Percentage of Leading Periods
We define a simple momentum strategy as follows:
- trade SHY, IEI, IEF, TLH, TLT
- rebalance weekly
- measure momentum over 1, 3, 6, 9, and 12 months
- for each momentum period, assign 20% of the total capital to the asset with the highest momentum
This scheme slightly expands the concept of assigning 100% capital to the 'best' asset.
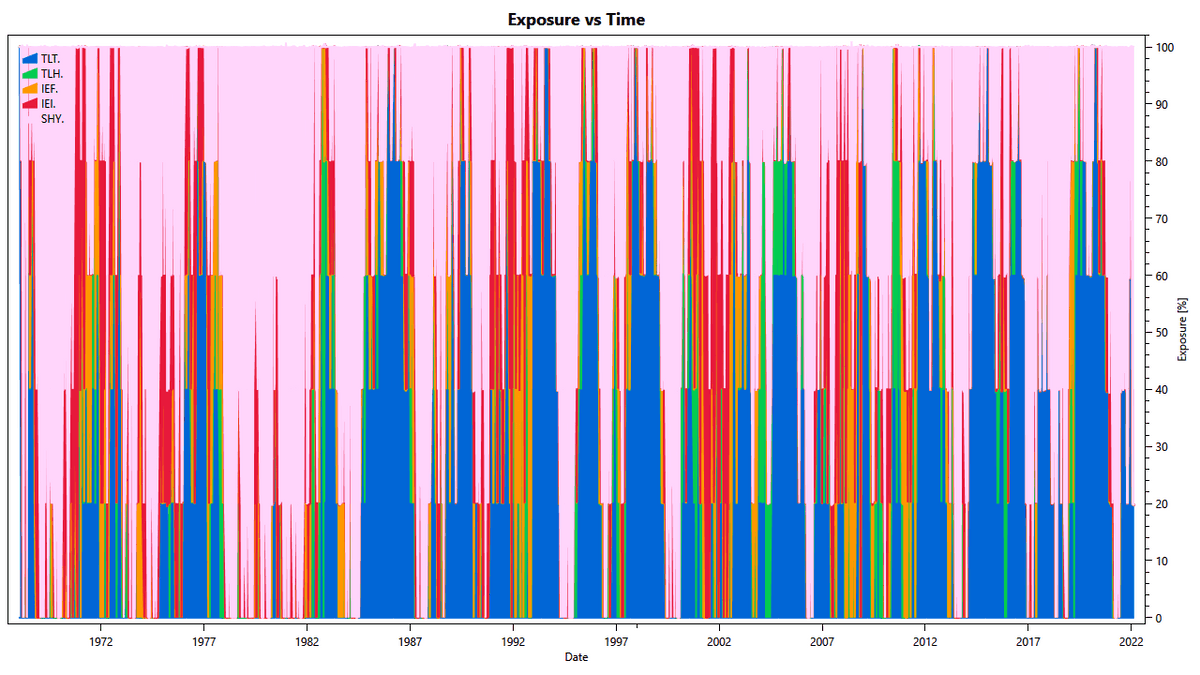
As anticipated, we see the strategy rotating nicely into shorter-term maturities between 1978 and 1981. This should help reduce interest rate risk. In other periods, e.g., from 1984 to 1987, we see the strategy rotating into long-term maturities. Doing so should help reap the profits from declining rates.
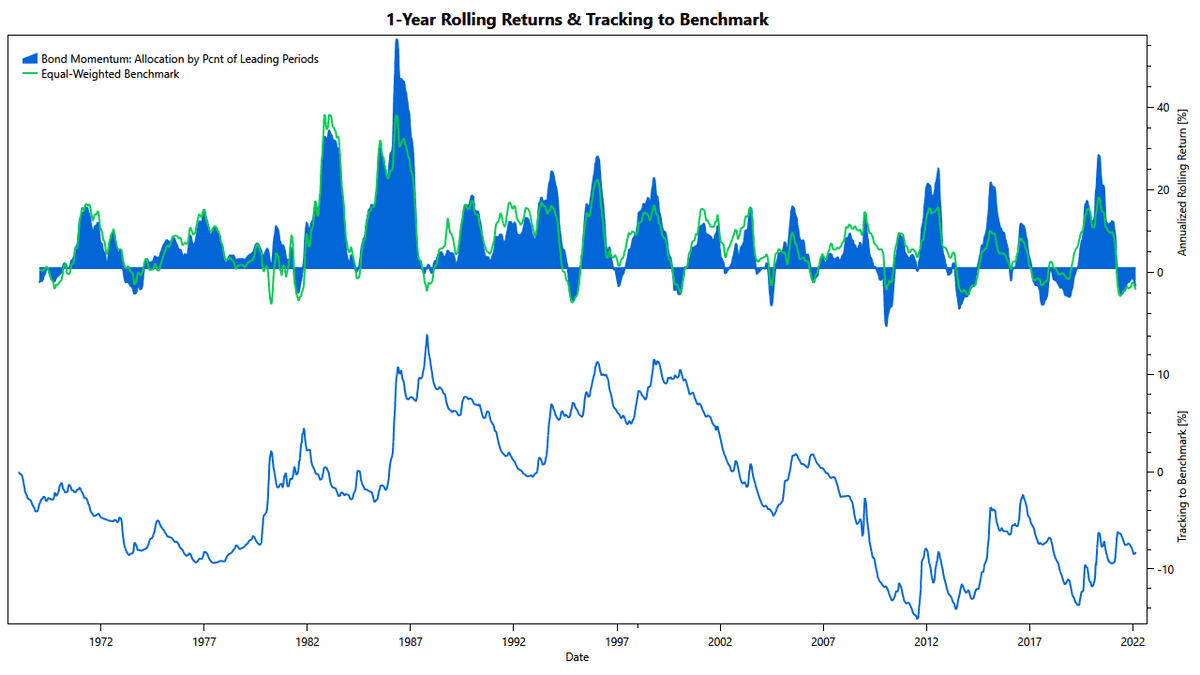
But, unfortunately, that's not enough. Indeed, the rolling returns show how the strategy cuts risk and improves returns in the periods mentioned above. But in many other periods, e.g., from 1987 to 1992, from 1999 to 2004, and from 2006 to 2011, the strategy trails its benchmark.
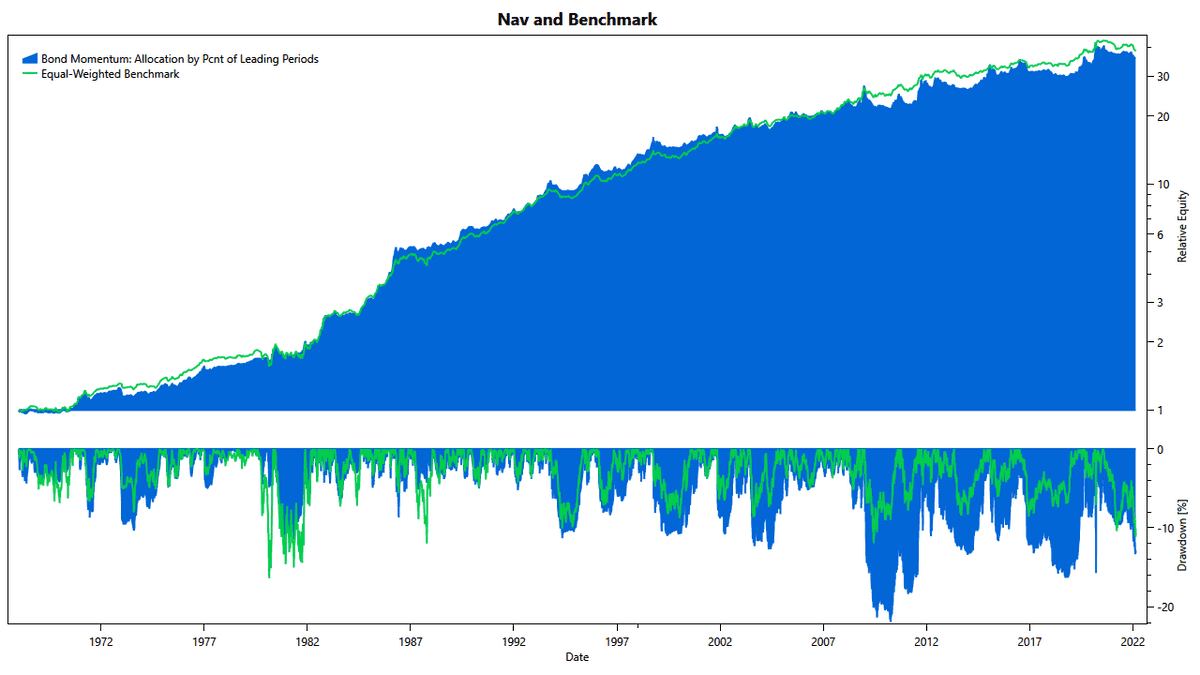
And when we look at the equity curve, it seems almost as if nothing has changed. Granted, there are some periods where the strategy reduced drawdowns. However, these are nullified by other periods, especially in the last ten years, where our trading resulted in almost twice the benchmark's downside. So, all in all, it's pretty much a wash.
Allocation by Percentage of Positive Periods
We define another simple momentum strategy as follows:
- trade IEI, IEF, TLH, TLT, and use SHY as a safe instrument
- rebalance weekly
- measure momentum over 1, 3, 6, 9, and 12 months
- for each asset and momentum period, assign 5% of the total capital unless the return is negative
- allocate any remaining capital to the safe asset
This method aims to keep a mix of maturities. This less aggressive stance may help prevent the strategy from ending up on the wrong side while holding an aggressive position.
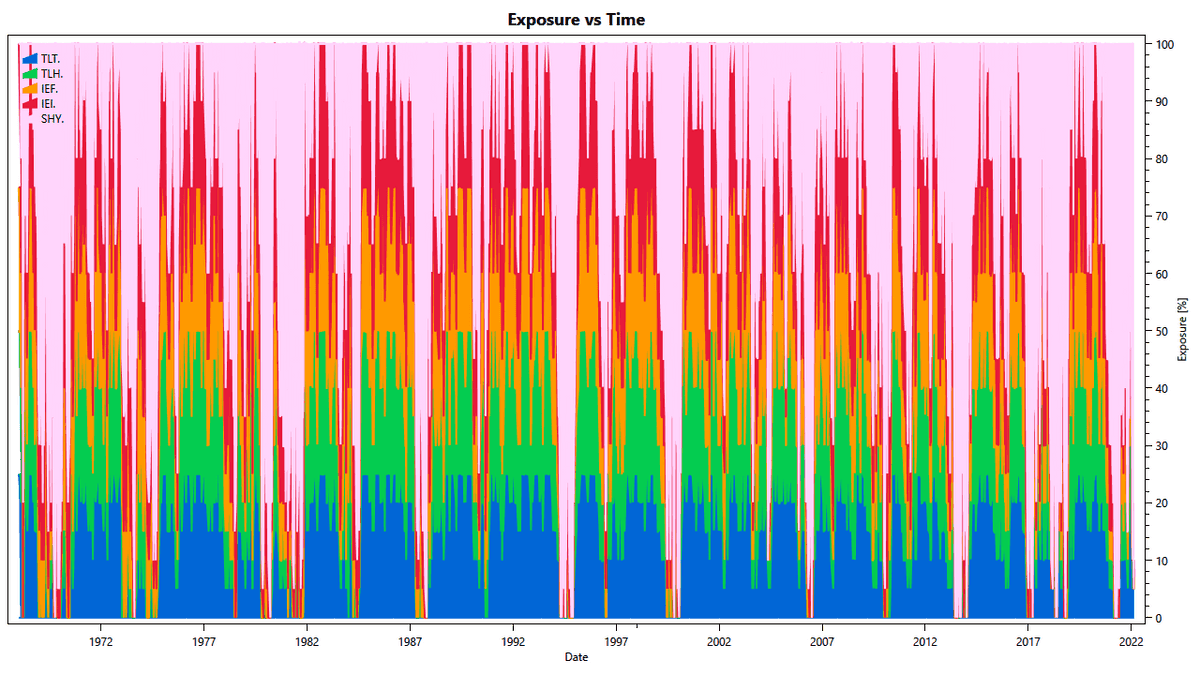
The exposure chart shows how the positions in the main assets, TLT, TLH, IEF, and IEI, are scaled back in periods of negative returns. We can see this nicely for the time leading up to the 1981 peak in interest rates. However, most of the time, we keep a blend of maturities. What sticks out is that there are only very brief periods during which all four assets are fully invested. Most of the time, the strategy keeps at least 20% in T-Bills.
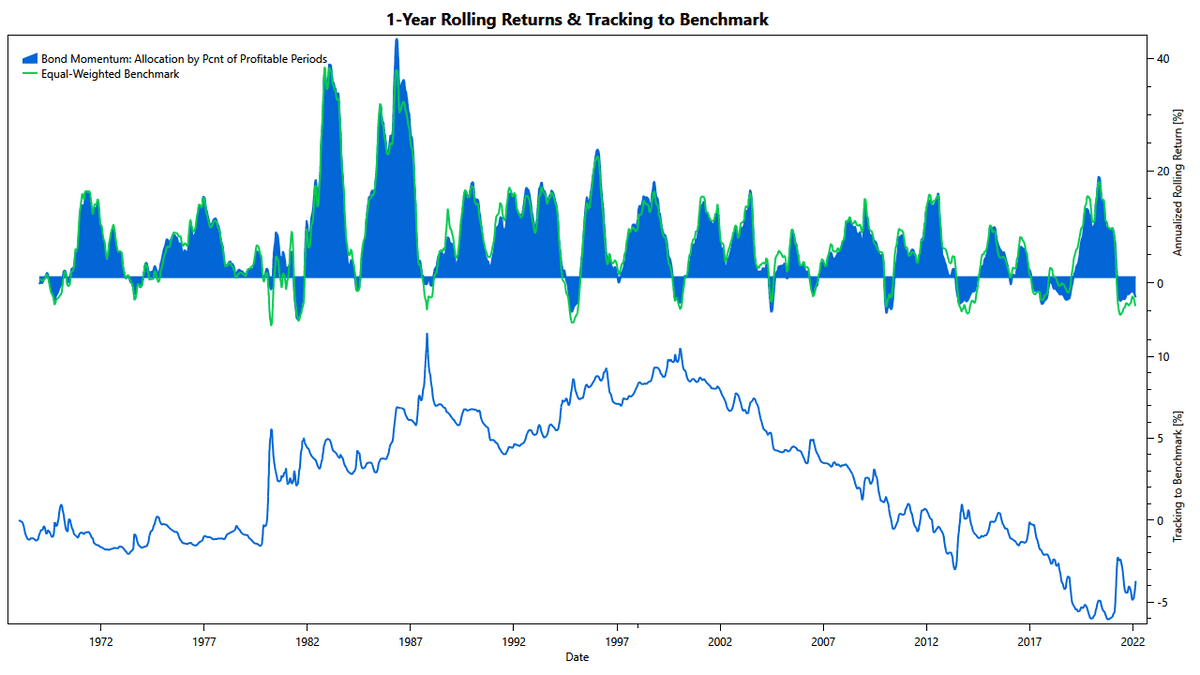
Much like before, the rolling returns show this strategy deviating only very little from its benchmark in either direction. Also, we can see the strategy consistently underperforming its benchmark since 2000, even though by only a small percentage. With these rolling returns, it is no surprise that the strategy's equity curve looks almost identical to the benchmark.
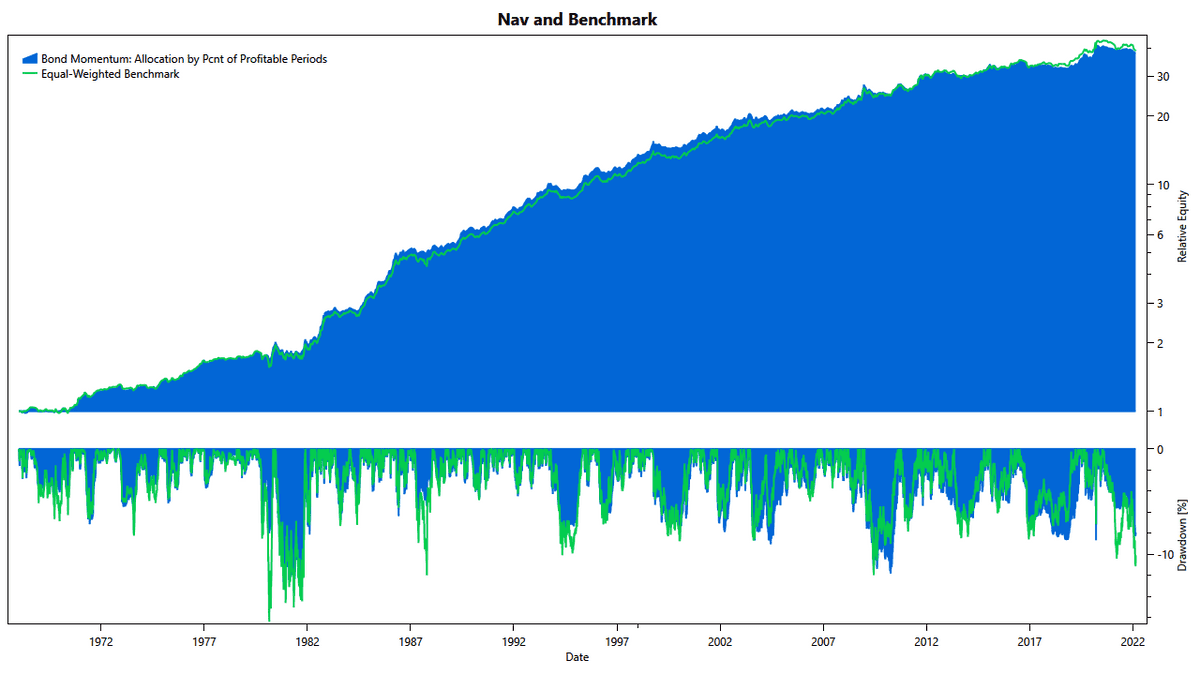
We tried improving the strategies in many ways. We experimented with more luxurious methods of measuring momentum. We tried different longer and shorter periods to measure momentum. We substituted the assets with others. And while the graphs changed some, none of the many variants we tested resulted in a continuous upside over the benchmark or improved risk-adjusted returns. This effort ultimately leaves us with only one conclusion: momentum doesn't work well for trading bonds. And while this is a valuable finding, we still need to understand why because this insight can help us identify better strategies.
Momentum strategies typically measure one asset's momentum relative to the others in the universe. In doing so, we eliminate so-called common-mode noise, which should improve the ranking quality. This method works very well for stocks because most have a beta to the overall market not too far from 1. However, this is not the case for bonds: their beta to the overall bond market easily ranges from 0.5 to 2.3. Under these conditions, there is very little common-mode noise to eliminate.
Above we found that bonds are highly correlated and mainly differ in their beta. It is almost like picking from a set of assets that only differ in their leverage. In upswings, long-term treasuries most often lead the universe, only to be the laggers in downswings. This results in leaders and laggers toggling their positions in rapid progression. The resulting noisy momentum signals are not suitable to reliably rank the assets. At the same time, more aggressive filtering makes the strategy too slow to respond to the markets, ending up on the wrong side of the market for too long to create an edge.
While we should not completely give up on the idea of trading bond momentum, any successful algorithm needs to take these unique properties of bonds into account.
Heine's Bond Trading Model
One way to improve a trading strategy's quality is to include macroeconomic indicators in the decision-making process. We have seen this approach in action in strategies trading the stock market, e.g., TuringTrader's Market Vane strategy or Keller's Lethargic Asset Allocation. However, we need to go far back to find precedent in bond trading strategies: Heine's Bond Trading Model was first published in Nelson Freeburg's Formula Research newsletter in 1995. Mark Boucher picked it up in 1999 for his book The Hedge Fund Edge#ad.
The rules to Heine's model are surprisingly simple:
- If bond prices are trending up, score +1 point; otherwise, give 0 points.
- If long-term treasury yields trend down, score +1 point; otherwise, give 0 points.
- If short-term treasury yields trend down, score +1 point; otherwise, give 0 points.
- If the Dow Jones Utility Average is trending up, score +1 point; otherwise, give 0 points.
- If the CRB Index is trending down, score +1 point; otherwise, give 0 points.
- Rebalance weekly. If the total score is three or more, hold bonds; otherwise, carry cash.
In a nutshell, this strategy follows two investing mantras: (a) Don't fight the tape, and (b) don't fight the Fed. But what are the last two rules for? The Dow Jones Utility Average represents a heavily leveraged industry, and serves as a proxy for the overall health of the bond market. The CRB Index represents the commodity market and serves as a proxy for inflation.
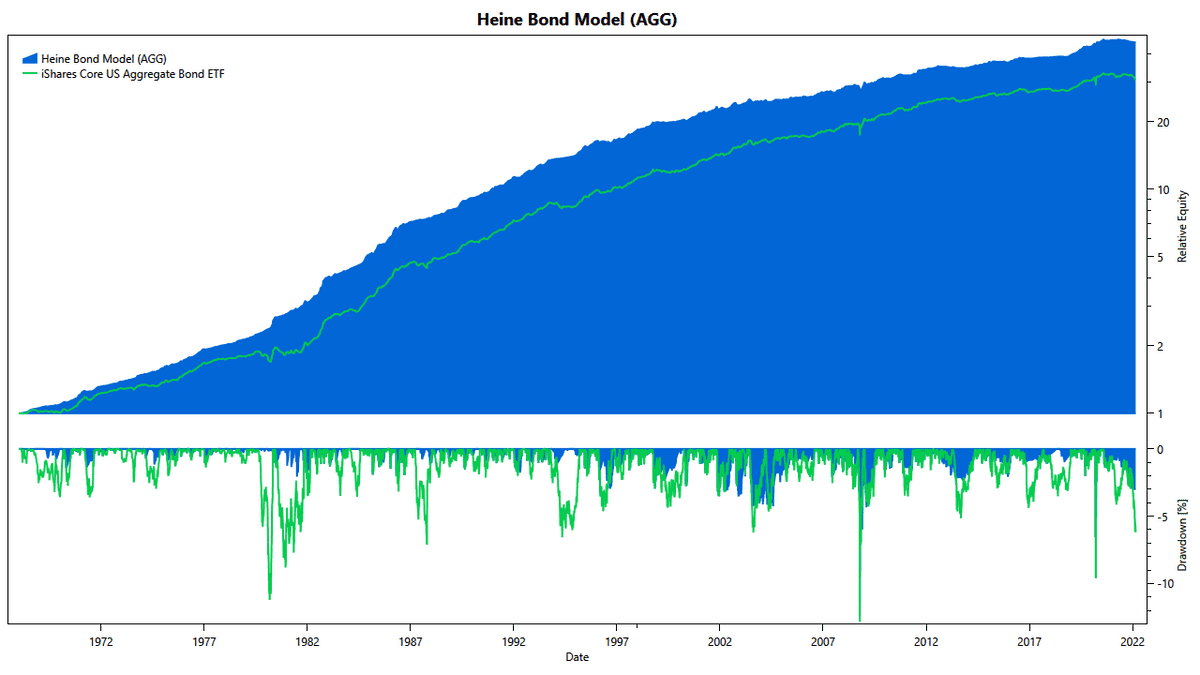
The chart above shows the strategy's performance for the aggregate bond market. Out of the box, this marks a success. The strategy has managed to create an upside over the past 54 years. But even better, the strategy has also dramatically limited the downside. Most notably, Heine's method worked very well in the time of rapidly rising rates before 1981, but the strategy's positive effect continues throughout the full simulation range.
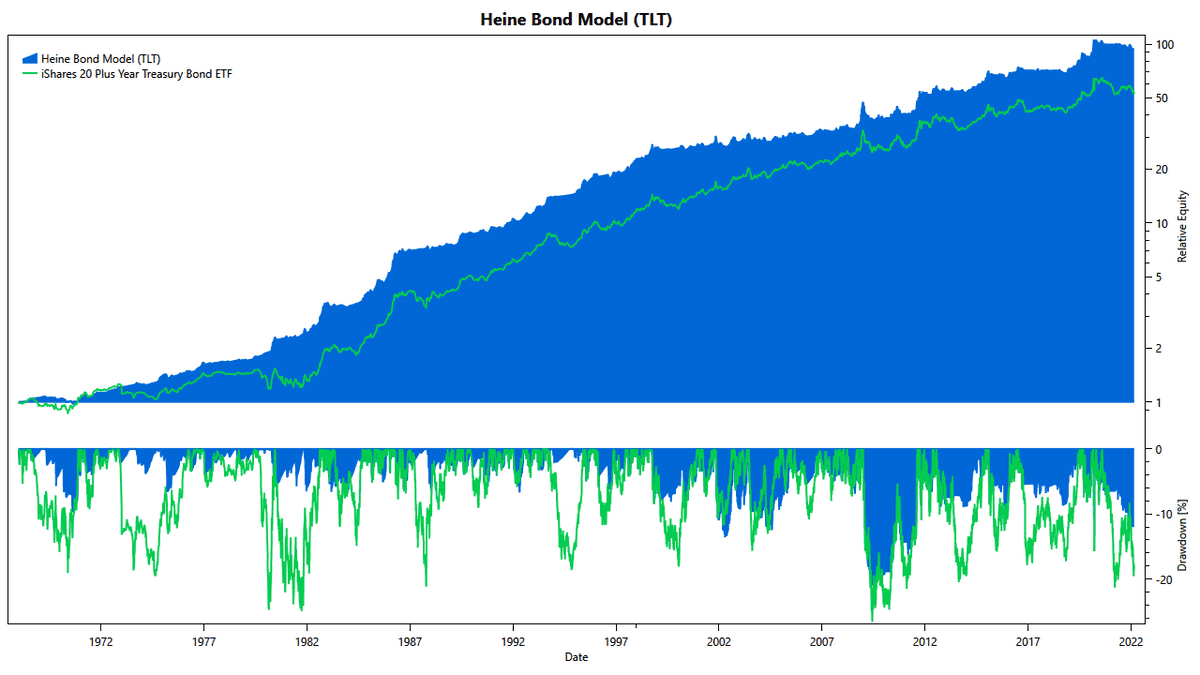
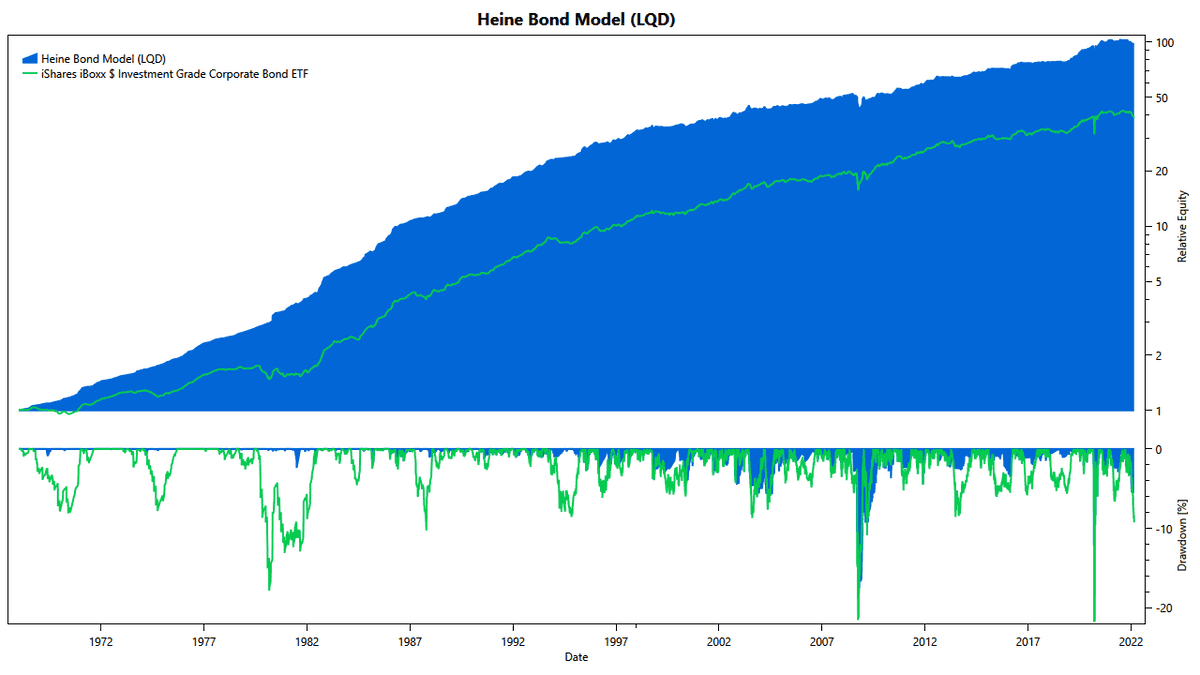
Heine suggested applying the strategy to other bond markets, and so did we. We tried U.S. Treasuries with long maturities and investment-grade corporate bonds. Again, Heine's Bond Trading Model demonstrates a substantial reduction of bond risks.
Expanding Heine's Model to Multiple Markets
While Heine's Bond Trading Model is a great start, it is limited to trading a single bond ETF. However, to create a solid upside in a wide range of economic situations, we want to expand the strategy to cover multiple bond markets.
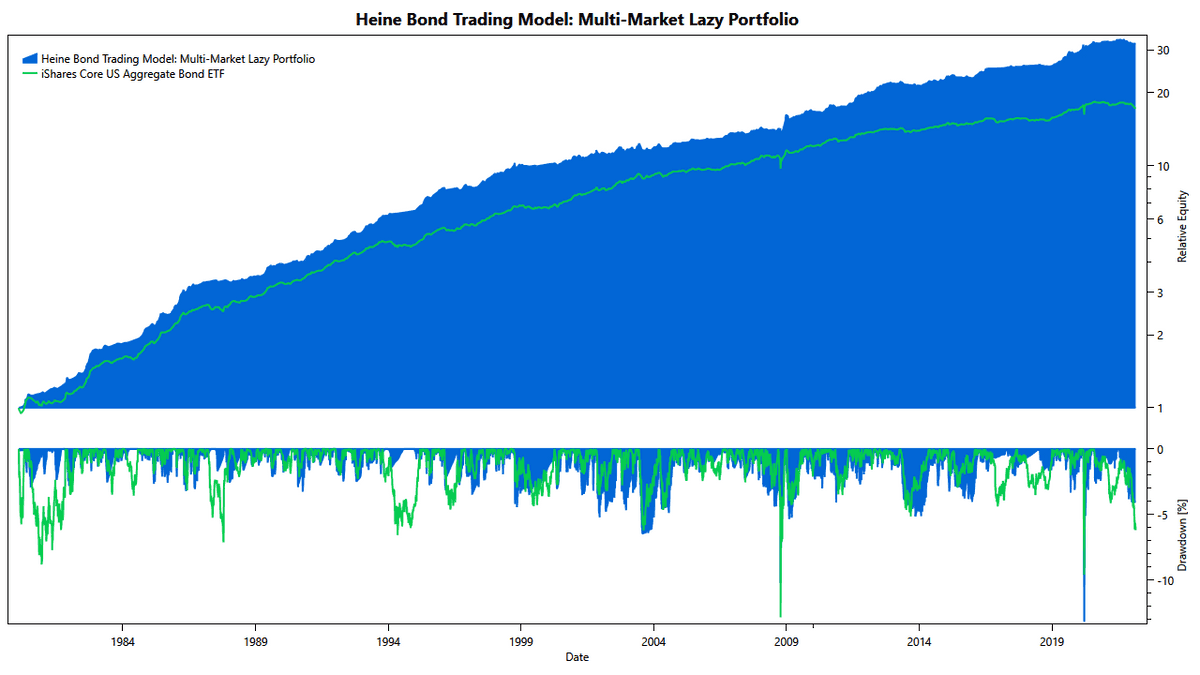
We tried the following rules:
- Create a lazy portfolio with four tranches.
- Trade Heine's Bond Model independently on IEF, TLT, LQD, and JNK
We like the simplicity of this approach, which ensures a stable balance between U.S. Treasuries and corporate bonds.
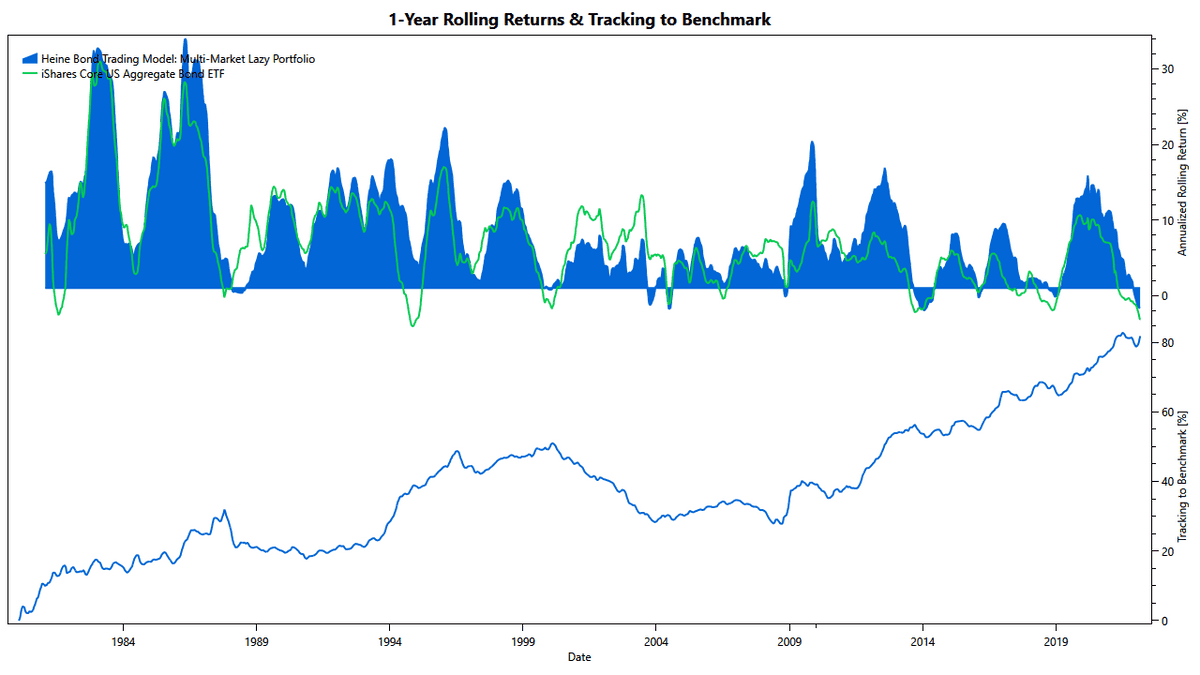
The results look pretty pleasing. Benchmarked against the aggregate bond market, our meta-strategy continuously produces an upside while at the same time keeping a similar risk profile. However, there are still some periods of negative returns, and the strategy underperformed from 2000 to 2003. Overall, this variant does not do anything that applying Heine's model to AGG didn't do.
TuringTrader's Buoy
To further drive returns, we created a slightly more complex meta-strategy based on Heine's Bond Trading Model:
- consider JNK, LQD, TLT, TLH, IEF, IEI, and SHY a universe with a known performance ranking use Heine's Bond Trading Model to determine investability for each asset in the universe in addition, validate high-yield bonds with Market Vane allocate equal capital to the top two investable assets if no investable assets exist, invest in the fallback asset choose TIPS and T-bills as the fallback asset, based on their relative momentum
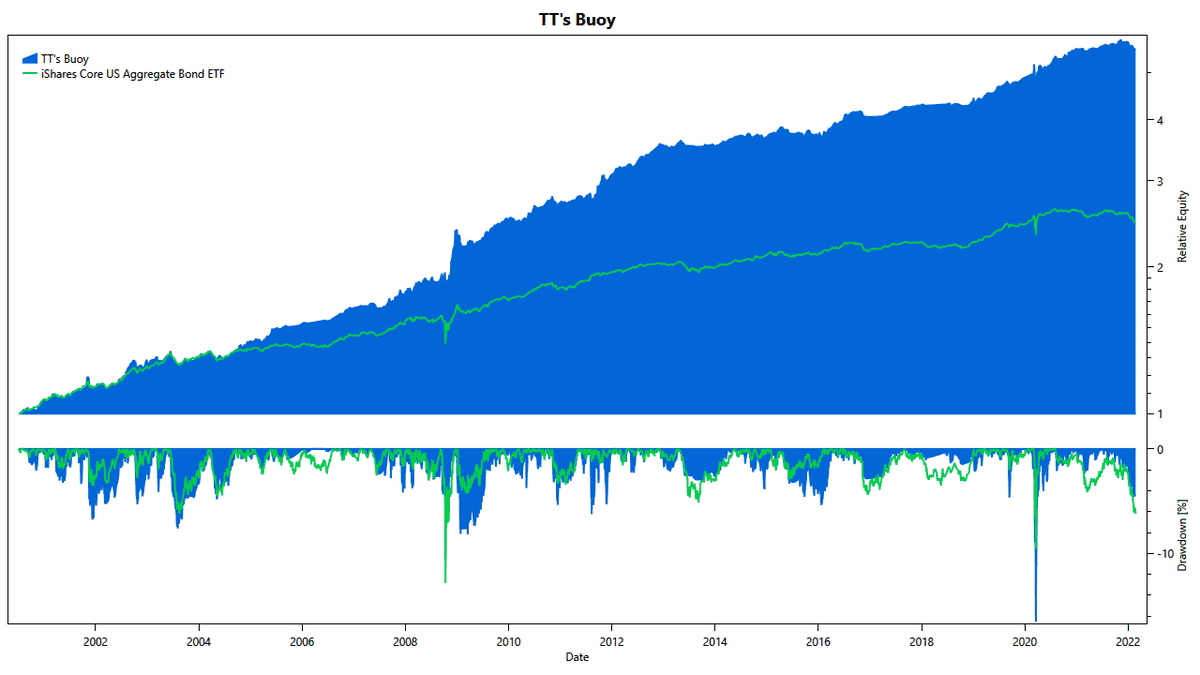
We call this new strategy TuringTrader's Buoy. The equity chart demonstrates how it has massively outperformed the aggregate bond market while maintaining a similar risk profile.
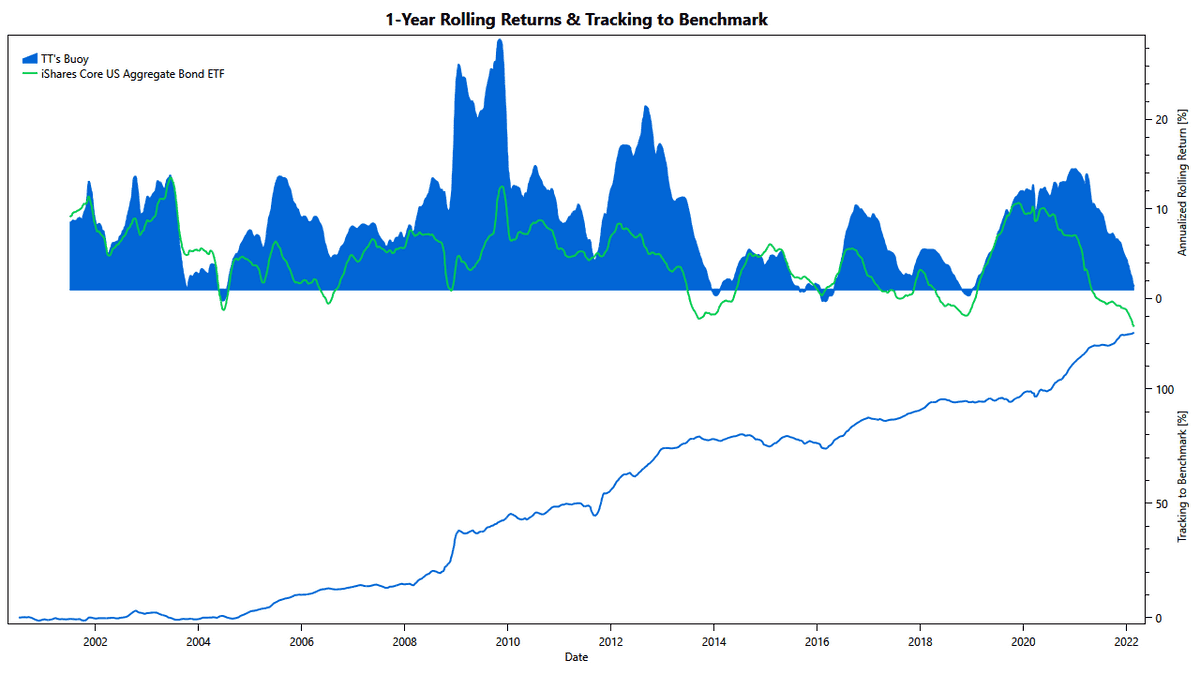
The rolling returns illustrate how the strategy has created a very smooth upside since 2004. At the same time, the Buoy strategy has nicely avoided periods of negative returns. Most importantly, the new strategy has worked well through periods of rising rates, particularly from 2016 to 2018 and from 2021 onward.
Conclusions
Our research brings us to the following conclusions:
U.S. Treasuries continue to be a valuable hedge for the stock market as they continue to negatively correlate to the U.S stock market, despite their historically low yields. This behavior anchors in the Flight-to-quality effect, which leads to investors piling into safer asset classes in times of crisis. And while other asset classes, e.g., VIX futures like Barclays' VXX, have higher hedging capabilities, these products typically have a negative carry, making market timing very critical. In contrast, U.S. Treasuries have a positive carry most of the time, which leads to more docile behavior.
Long-term Treasuries have better hedging properties but also much more volatility. A tactical bond strategy should gravitate toward longer maturities but reduce bond duration in times of rising yields to avoid drawdowns. Traditional methods based on relative momentum are not suitable for the task.
A high-powered bond strategy should include asset classes beyond U.S. Treasuries as a method to maintain positive returns across a broad range of economic scenarios. Asset classes to consider are corporate bonds, junk bonds, or convertible bonds.
TuringTrader's Buoy aligns well with these findings. It combines investments in U.S. Treasuries of various maturities with corporate bonds of investment-grade and junk quality. As a result, we are confident that our Buoy portfolio will help stabilize balanced portfolios while at the same time significantly improving returns over the aggregate bond market.

